
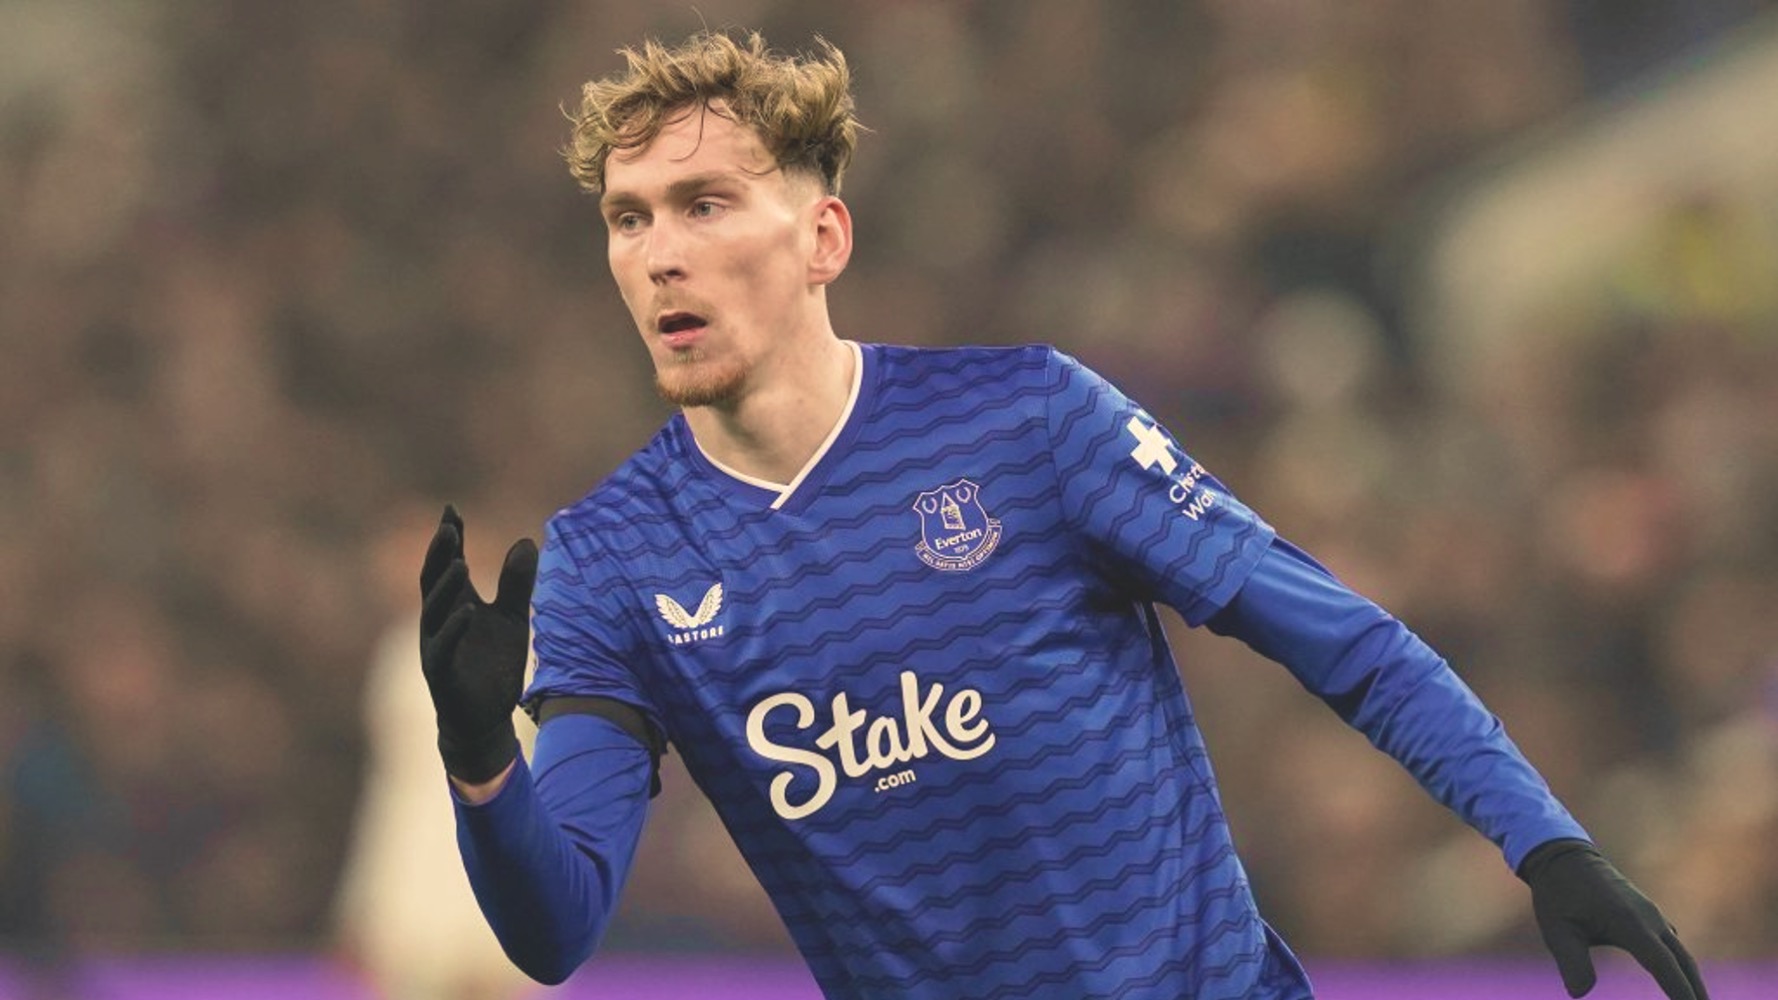
James Garner seemingly did everything for Everton in 2025/26.
He started all 38 Premier League matches. He covered 415.46 kilometres, more than any other player in the competition. He won a league-high 71 tackles and shared the lead for interceptions with 59. Premier League Premier League FBref
He also produced the best attacking return of his Premier League career: two goals and seven assists. FBref
And Everton did not even keep him in the same position.
Garner started matches at left-back, right-back, defensive midfield and central midfield. Three of his first four league appearances came at left-back, while Everton were still using him at right-back much later in the campaign. FBref Opta Analyst Premier League
That creates an obvious temptation.
Call Garner positionless. Present him as the same all-action footballer appearing in different parts of the pitch.
Except the numbers do not support it.
FIVDA separated Garner’s seven Premier League starts at full-back from his 31 in midfield. His statistical profile changed substantially.
He crossed more frequently from full-back.
But he won fewer tackles and made fewer interceptions.
Garner’s season was not remarkable because position stopped mattering.
It was remarkable because position did matter — and Everton could move him anyway.
First, the 415-kilometre headline needs context
Garner covered more ground than anyone else in the Premier League.
Premier League tracking data recorded 415.46km across 3,414 minutes, ahead of Elliot Anderson on 411.06km and Adrien Truffert on 402.59km. Premier League
That is an extraordinary workload.
But total distance measures two things at once.
How much a player runs.
And how long he stays on the pitch.
Garner did plenty of both.
FIVDA’s calculation from the Premier League data puts him at approximately 10.95km per 90 minutes. Among the ten players who covered the greatest total distance, that ranks sixth — not first. Premier League
Ethan Ampadu, for example, covered 398.06km in 3,123 minutes, equivalent to approximately 11.47km per 90. Jarrod Bowen and Elliot Anderson also recorded higher rates within that group. Premier League

Figure 1 — Garner ran furthest — but not furthest per 90.
This does not make Garner’s physical season less impressive.
It makes the achievement more precise.
He was not necessarily the Premier League’s most intense runner every time he stepped onto the pitch.
He combined a high running rate with exceptional availability.
FBref records 38 starts and 3,413 minutes. Premier League tracking data have him one minute higher at 3,414. FBref Premier League
Garner’s distance record was therefore partly an endurance statistic and partly an availability statistic.
The defensive numbers are harder to explain that way.
Playing every week cannot explain 71 tackles won
Garner finished first in the Premier League for tackles won, with 71.
João Gomes was second on 68, Mateus Fernandes had 67 and João Palhinha 66. Premier League
Garner also recorded 59 interceptions, sharing the league lead with Moisés Caicedo. Marcos Senesi was next on 56. Premier League


Figure 2 — Garner led two different Premier League defensive categories.
That combination tells us something the distance figure cannot.
Tackles won describe direct interventions against opponents.
Interceptions reward something different: recognising and occupying passing lanes before the ball reaches its target.
Garner finished at the top of both categories.
Availability undoubtedly helped his totals. Playing virtually every available minute gives a player more opportunities to accumulate defensive actions.
But availability cannot completely explain the level of involvement.
At Opta’s mid-season checkpoint, Garner was averaging a career-high 4.4 tackles plus interceptions per 90 minutes. Opta Analyst
He was not merely collecting large totals because Everton kept selecting him.
He was producing defensive actions at a high rate while they did it.
Garner was becoming more important with the ball too
The defensive statistics only capture one part of the season.
At the same mid-season Opta checkpoint, Garner was averaging career highs of 68.1 touches and 45.6 passes per 90. Opta Analyst
More revealingly, he led Everton with 146 line-breaking passes, including 79 in the final third. Fifteen of those passes were followed by an Everton shot within 10 seconds. Opta Analyst
A line-breaking pass is essentially one that moves the ball beyond a line of opposition players rather than simply circulating possession around them.
That matters for understanding Garner.
His value was not limited to running and recovering the ball. Everton were also using him to move possession through opposition structures. FIVDA’s earlier analysis of the Premier League’s most all-around midfielders examined the same broader problem: how to identify players whose influence extends across multiple phases of the game.
Opta recorded Garner being involved in 72 open-play sequences that ended with an Everton shot at that stage of the season, with only Jack Grealish recording more for the club. Opta Analyst
His final attacking numbers reinforce the broader progression.
Garner finished with two goals and seven assists, giving him nine Premier League goal contributions. His previous best Everton league season had produced three. FBref

Figure 3 — Garner’s attacking contribution reached a new level in 2025/26.
None of that proves positional flexibility caused the improvement.
It establishes something more useful.
Everton were moving Garner around the team at the same time as his overall responsibility was increasing.
Then Everton kept moving him
Garner’s versatility was not simply a midfielder filling in once during an injury crisis.
It started that way.
Everton used a 4-2-3-1 against Leeds on the opening weekend, with Premier League analysis describing Garner as a makeshift left-back and noting the structural imbalance created by using a central midfielder there. Premier League
Garner later explained that he had never previously played left-back. David Moyes told him shortly before the Leeds match that injuries might require him to fill in at full-back, and Garner initially did not even know whether that meant the left or right side. Everton
He started the opening two Premier League matches there. Everton
But the experiment did not disappear when the opening injury problem passed.
FBref’s match logs record seven full-back starts across the season: three at left-back and four at right-back. Those matches totalled 630 minutes, leaving 31 midfield starts and 2,783 midfield minutes. FBref
The right-back starts included Fulham, Bournemouth, Manchester United and Arsenal. FBref
Premier League reporting independently confirms Garner playing right-back against Bournemouth and Arsenal, showing that the defensive usage extended well beyond Everton’s opening weeks. Premier League Premier League
Seven matches is still a small sample.
But it is enough to ask the question the season created.
When Everton moved Garner, did he actually remain the same player?
No — and that makes his versatility more interesting
FIVDA separated Garner’s seven full-back starts from his 31 midfield starts using FBref’s match-level position and event data. FBref FBref
The differences are clear.
Across 630 full-back minutes, Garner produced 42 crosses, 10 tackles won and seven interceptions.
Across 2,783 midfield minutes, he produced 163 crosses, 62 tackles won and 50 interceptions. FBref FBref
Adjust for playing time and the profile changes.
Garner averaged 6.00 crosses per 90 at full-back, compared with 5.27 in midfield — approximately 14% higher.
But his tackles won fell from 2.01 per 90 in midfield to 1.43 at full-back, a drop of around 29%.
His interceptions fell from 1.62 to 1.00 per 90, approximately 38% lower. FBref FBref
Combine tackles won and interceptions and Garner produced 3.62 per 90 from midfield against 2.43 from full-back — a difference of approximately 33%. FBref FBref
This is the finding that changes the story.
Full-back was not simply “midfield Garner standing wider”.
His output changed with his starting position.
Position flexibility is not role invariance
The crossing numbers point towards more wide delivery when Garner started at full-back.
That is consistent with a player beginning from wider areas and finding more opportunities to cross from the flank.
But crosses alone do not prove that Garner became a conventional overlapping full-back. The aggregate data cannot tell us precisely where every delivery originated or what movement preceded it.
The defensive difference is similarly striking without being causal.
Garner’s combined tackles-won-and-interceptions rate was about one-third lower in the full-back sample than in midfield. FBref FBref
Central midfield naturally offers potential access to second balls, midfield duels, central passing lanes and counter-pressing situations.
That is consistent with the statistical split.
It does not prove those mechanisms caused it.
The seven full-back matches came against different opponents, with different Everton selections, game states and injury circumstances. A larger sample might produce different rates.
So the important conclusion is descriptive rather than causal.
When Everton changed Garner’s position, his statistical responsibilities changed with it.
That sounds obvious.
It reflects a broader positional problem FIVDA has explored elsewhere: the label attached to a player’s starting position does not necessarily tell us which functions he is performing.
But it is precisely why calling him “positionless” misses the interesting part.
There are limits to what we can split by position
There is also a methodological boundary to the analysis.
FBref provides public match-log structures for passing, possession and goal-creation categories, including fields such as touches, progressive actions and shot-creating actions. But the complete advanced numerical cells needed for a defensible 2025/26 full-back-versus-midfield comparison were not consistently exposed in the retrieved public match logs. FBref FBref FBref
That means FIVDA cannot make the same position-specific claim about Garner’s progressive passing, touches or shot creation.
Opta’s season-level evidence does show that he carried substantial progression responsibility during a campaign containing significant full-back usage. Opta Analyst
But that is not the same as proving his passing profile remained unchanged when his position changed.
The distinction matters.
We can show that his crossing, tackling and interception rates changed.
We cannot assume every other part of his game behaved the same way.
So what actually stayed constant?
Not Garner’s statistical role.
His importance.
Everton could ask him to start on either side of the defence or return him to central midfield and still keep him in the XI.
He started all 38 league matches. FBref
He sustained a high physical workload across virtually the entire season and finished first in the league for total distance covered. Premier League
He led the competition in tackles won and shared the interceptions lead. Premier League
He produced career-high passing and touch rates at Opta’s mid-season checkpoint, led Everton for line-breaking passes and ultimately recorded his best Premier League goals-and-assists return. Opta Analyst FBref
That is a stable value proposition, not a stable role.
Garner’s position changed what he did.
It did not change Everton’s willingness to rely on him.
That is a better definition of versatility
Football often talks about versatility as though the ultimate compliment is that a player can go anywhere and remain unchanged.
Garner’s season suggests a more useful definition.
The best versatile players may not be those who ignore position.
They may be those whose skill set is broad enough for different positions to draw out different useful functions. That adaptability also fits a Premier League season in which tactical value increasingly came from having multiple ways to solve the same problem rather than committing to one method.
Move Garner to full-back and the crossing rate increased while his defensive event profile fell.
Return him to midfield and tackles won and interceptions became much more prominent.
Across the season as a whole, he still progressed possession, contributed defensively, remained available and produced his best Premier League attacking return. FBref Opta Analyst
The seven full-back starts are too small a sample to tell us what Garner would look like as a permanent defender.
They are enough to reject the simpler idea that Everton were merely moving the same role around the pitch.
Garner was not valuable because position did not matter to him.
He was valuable because it did.
And when Everton changed his position, he changed with it.
Let us know your thoughts in the comment section below, we’d love to hear them!
Stay tuned for future posts and please send us a message if there is a specific topic you would like to see covered.
As always, thanks for taking the time to read these posts!
JC
Sources for the data presented are referenced within the article.
The main image is from Squawka.